Setting Up Your Admin Dashboard
After downloading and installing Magento, the next step is the Dashboard. It is quite important to familiarize yourself with the appearance and working of the dashboard.
The first page that greets you after you log in to the Admin of your Magento website is the beautifully designed yet intimidating dashboard. The dashboard gives a brief overview of the website’s sales as well as it’s recent customer activity.
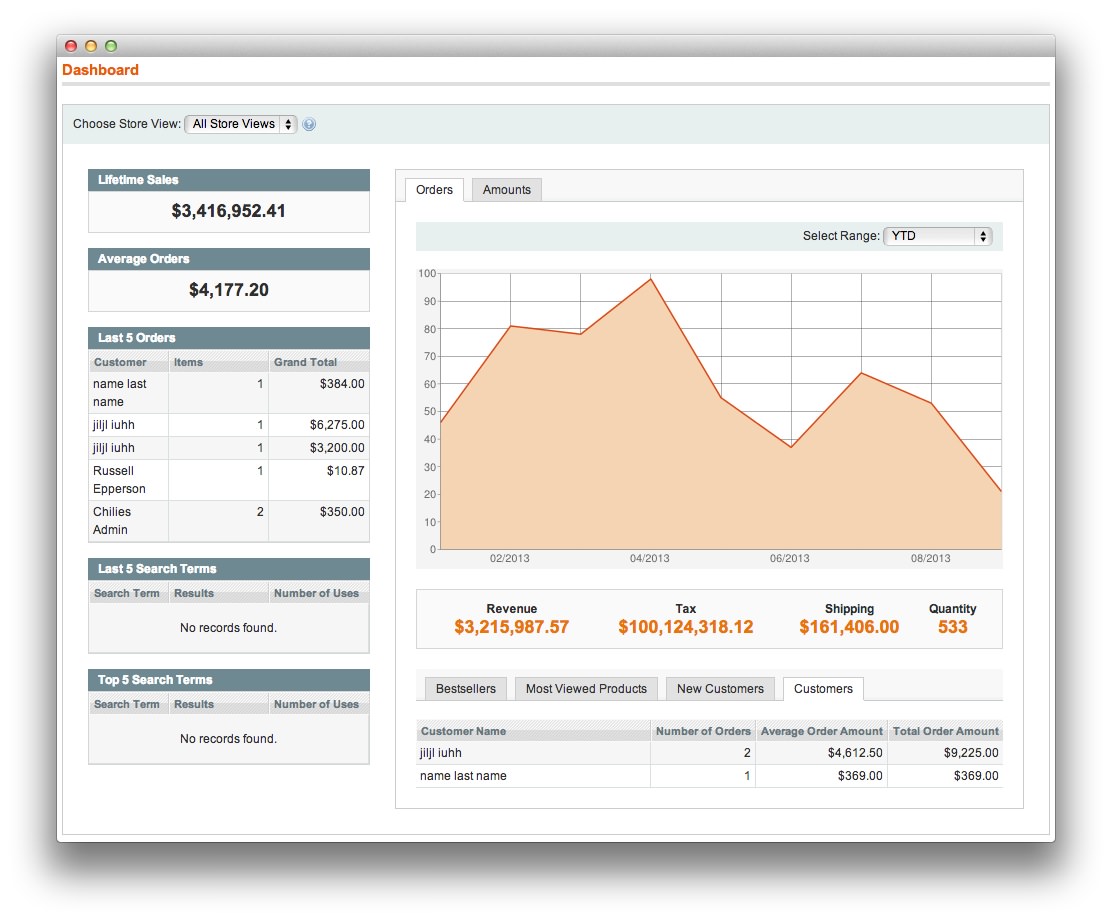 The blocks on the left provide a snapshot of lifetime sales, average order amount, the last five orders, and search terms. The graph depicts the orders and amounts for the selected date range. You can use the tabs above the graph to toggle between the two views.
Although by default, the dashboard is the startup page for the Admin, you can change the configuration to show a different page when you log in. You can also set the starting dates used in dashboard reports, and disable the display of the charts section.
To set the date range:
Set Select Range to one of the following:
Last 24 Hours
Last 7 Days
Current Month
YTD
2YTD
To set the starting dates:
- On the Admin menu, select System > Configuration.
- In the Configuration panel on the left, under General, select Reports.
- Click to expand the Dashboard section, do the following:
- Set Year-To-Date Starts to the month and year that the current year began.
- Set Current Month Starts to the current month.
To change the Admin startup page:
- On the Admin menu, select System > Configuration. Then in the panel on the left, under Advanced, select Admin.
- In the Admin UI section, set Startup Page to the page you want to first appear when you log in to the Admin.
- Click the Save Config button to save the setting.
To turn off real-time data:
If you have a lot of data to process, the performance of the Dashboard can be improved by turning off the display of real time data.
- On the Admin menu, select System > Configuration. Then in the Configuration panel on the left, under Sales, select Sales.
- Click to expand the Dashboard section. Then, set Use Aggregated Data (beta) to “Yes.”
To disable charts:
- On the Admin menu, select System > Configuration. Then in the Configuration panel on the left, under Advanced, select Admin.
Turn Off Dashboard Charts
- In the Dashboard section, set Enable Charts to “No.”
- When complete, click the Save Config button.
A message on the Dashboard indicates that the chart is now disabled.
Having done these, you are now quite familiar with the basics of the Magento Dashboard.

